简体中文
繁體中文
English
Pусский
日本語
ภาษาไทย
Tiếng Việt
Bahasa Indonesia
Español
हिन्दी
Filippiiniläinen
Français
Deutsch
Português
Türkçe
한국어
العربية
FPG META Market Report August 1, 2025
Sommario:META sustained its bullish trajectory on the weekly timeframe, recently around 775.42 after reaching a high of 784.48. Price has continued to print higher highs with strong momentum, breaching the pri
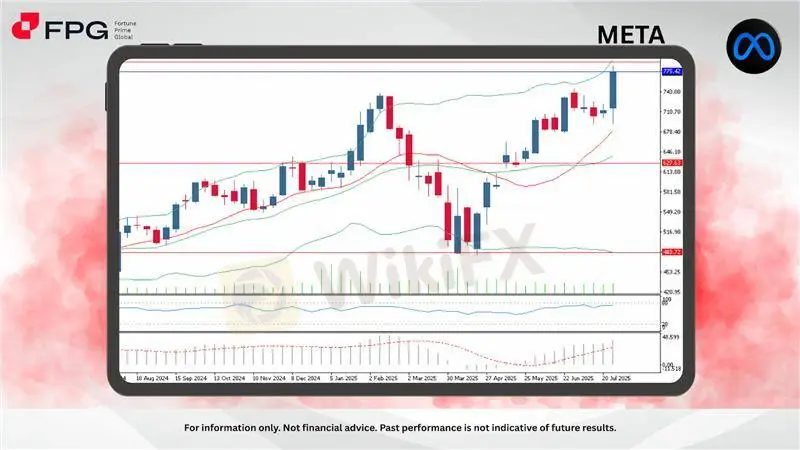
META sustained its bullish trajectory on the weekly timeframe, recently around 775.42 after reaching a high of 784.48. Price has continued to print higher highs with strong momentum, breaching the prior consolidation range near 743 and solidifying its bullish structure. Institutional interest and investor confidence appear intact as the stock pushes into new territory.
This weeks candle formed a solid bullish body, extending the trend that began in April 2025. META decisively broke out above the 743 resistance level, closing well above the middle line of the Bollinger Bands and approaching the upper band boundary. Volume supported the move, showing increased participation in the breakout rally.
The MACD indicator continues to show bullish divergence, with the MACD line well above the signal line and both ascending steeply, a classic indication of persistent upward momentum. Price is also trading significantly above the 50-week moving average, and the Bollinger Bands have widened further, confirming volatility expansion and trend strength. Despite these bullish signs, a short-term cooldown may emerge near the psychological 800 level.
Momentum remains firmly bullish, with indicators favoring continuation but cautioning overextension. The Money Flow Index (MFI) currently reads 72.69, just below the overbought threshold, suggesting buyers remain dominant, although inflows may start to moderate. As price hovers near the upper Bollinger Band, momentum-driven traders may look for signals of short-term exhaustion or continuation confirmation.
Market Observation & Strategy Advice
1. Current position: META traded around 775, maintaining its bullish breakout and confirming upward continuation with a strong weekly close above the 743 breakout level.
2. Resistance: 785 stands as the next resistance zone, coinciding with the previous upper wick and sitting just below the psychological 800 round number, which may invite seller interest.
3. Support: 627 remains key support, marking the last significant consolidation area and aligning with the midline of the Bollinger Bands.
4. Indicators: MFI (14) at 72.69 reflects sustained buying interest, although it flirts with overbought territory, calling for alertness to potential short-term pullbacks or consolidation. MACD remains strongly bullish, with increasing separation from the signal line, reinforcing the momentum strength and signaling trend continuation.
5. Trading Strategy Suggestions:
Momentum traders may target 790–800 with tight trailing stops to lock in gains while allowing room for further upside.
Dip-buying entries can be considered near 740–720 in case of retracement, particularly if volume contracts and price stabilizes.
Profit-taking or partial exits are advisable near resistance zones, especially if bearish divergences or volume weakness appear in the coming sessions.
Market Performance:
Stocks Last Price % Change
AAPL 207.57 −0.71%
TSLA 308.27 −3.38%
Today's Key Economic Calendar:
CN: Caixin Manufacturing PMI
EU: Inflation Rate YoY Flash
US: Non Farm Payrolls
US: Unemployment Rate
US: ISM Manufacturing PMI
Risk Disclaimer This report is for informational purposes only and does not constitute financial advice. Investments involve risks, and past performance does not guarantee future results. Consult your financial advisor for personalized investment strategies.
Disclaimer:
Le opinioni di questo articolo rappresentano solo le opinioni personali dell’autore e non costituiscono consulenza in materia di investimenti per questa piattaforma. La piattaforma non garantisce l’accuratezza, la completezza e la tempestività delle informazioni relative all’articolo, né è responsabile delle perdite causate dall’uso o dall’affidamento delle informazioni relative all’articolo.
WikiFX Trader
AvaTrade
XM
IC Markets Global
OANDA
IronFX
FXTRADING.com
AvaTrade
XM
IC Markets Global
OANDA
IronFX
FXTRADING.com
WikiFX Trader
AvaTrade
XM
IC Markets Global
OANDA
IronFX
FXTRADING.com
AvaTrade
XM
IC Markets Global
OANDA
IronFX
FXTRADING.com
Rate Calc

