简体中文
繁體中文
English
Pусский
日本語
ภาษาไทย
Tiếng Việt
Bahasa Indonesia
Español
हिन्दी
Filippiiniläinen
Français
Deutsch
Português
Türkçe
한국어
العربية
Soft CPI Deepens Economic Concerns, Gold Hits Fresh Highs
Abstract:After a wave of enthusiasm, U.S. equities pulled back yesterday. Beyond former President Trumps announcement of a 145% tariff hike on Chinese goods, no new developments emerged. Markets are beginning
After a wave of enthusiasm, U.S. equities pulled back yesterday. Beyond former President Trump's announcement of a 145% tariff hike on Chinese goods, no new developments emerged. Markets are beginning to price in the broader economic impact of these tariffs. Although the extreme tariff levels are delayed for 90 days, a general increase to 10% across multiple countries is expected to weigh on global growth.

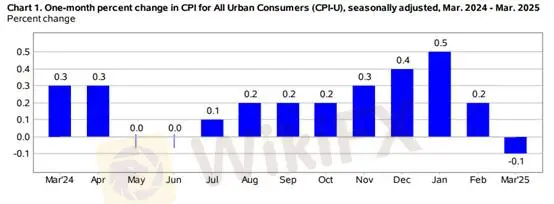
(Chart 1: U.S. CPI MoM, Source: BLS)
March CPI data released by the Bureau of Labor Statistics (BLS) showed a broad-based decline. The unadjusted year-over-year CPI came in at 2.4%, down 0.4 percentage points from the previous reading, marking the third consecutive month of deceleration and returning to levels seen when the Fed first cut rates in September last year. Core CPI also declined, falling to 2.8% YoY. Seasonally adjusted month-over-month CPI printed at -0.1%, its first monthly contraction in nearly five years. Core CPI slowed to a modest 0.1% gain.
Energy prices dropped sharply alongside a global decline in oil, pulling the transport services index lower. On the goods side, apparel and household furnishings both saw monthly declines of 0.2 percentage points, printing at 0.4% and 0.0%, respectively. Recreational goods rose 0.4 percentage points, yet still posted negative growth at -0.3%.

(Chart 2: GDPNow Forecast Model, Source: Atlanta Fed)
The Atlanta Feds GDPNow model reflects the distortion caused by the tariff war. As of January 31, U.S. companies began front-loading imports, driving the import index higher. However, CPI data shows that key tariff-affected categories—apparel, home goods, and recreation—declined month-over-month, suggesting that tariffs did not lead to higher consumer prices. If April CPI data continues to slide, it could point to weakening consumer demand. Meanwhile, rising inventories may force businesses to cut prices, pressuring profit margins.
As of April 9, the GDPNow model continues to factor in weak trade data, maintaining a negative Q1 2025 GDP forecast. The New York Feds latest Q1 GDP estimate, released April 4, also fell 0.26 percentage points to 2.6%. While macro data still indicates overall economic resilience, markets remain cautious. Investors are increasingly wary of the real-world impact of tariffs, prompting a pullback from risk assets. Meanwhile, gold continues its rally, buoyed by safe-haven flows and softer inflation figures.
Gold Technical Analysis

On the hourly chart, gold faces resistance near 3221. A bullish bias is favored today. If gold breaks above the 3221 resistance level, a light long position may be considered. According to Fibonacci retracement analysis, further resistance is expected around 3240. In the event of a pullback, shorting is not advised. Instead, monitor the 3185 support zone or the hourly 5MA; if these levels hold, a light long entry with a tight $5–10 stop loss may be warranted.
Support: 3185
Resistance: 3220
Risk Disclaimer: The views, analysis, and data presented are for general market commentary only and do not represent the position of this platform. All readers should conduct their own due diligence and assume full responsibility for their trading decisions.
Disclaimer:
The views in this article only represent the author's personal views, and do not constitute investment advice on this platform. This platform does not guarantee the accuracy, completeness and timeliness of the information in the article, and will not be liable for any loss caused by the use of or reliance on the information in the article.
WikiFX Broker
Latest News
"Rate & Reward: Broker Review Contest"
FSRA Sanctions Hayvn Group and CEO for Regulatory Breaches and Misleading Conduct
2024 AI Ad-Blocking Performance Revealed
Why Are More Regulated Brokers Providing Free VPS Services?
SkyLine Guide 2025 Thailand Officially Launched: Judging Panel Formation Underway
Five UK Financial Firms Collapse, FSCS Offers Support for Affected Clients
Why Trade Agreements Matter to Nations
Non-Existent Online Scheme Took Away RM580,000
RM15 Million Gone in Fake Investment Scam
CySEC Issues Investor Alert on Unauthorized Financial Websites
Currency Calculator


